On this page
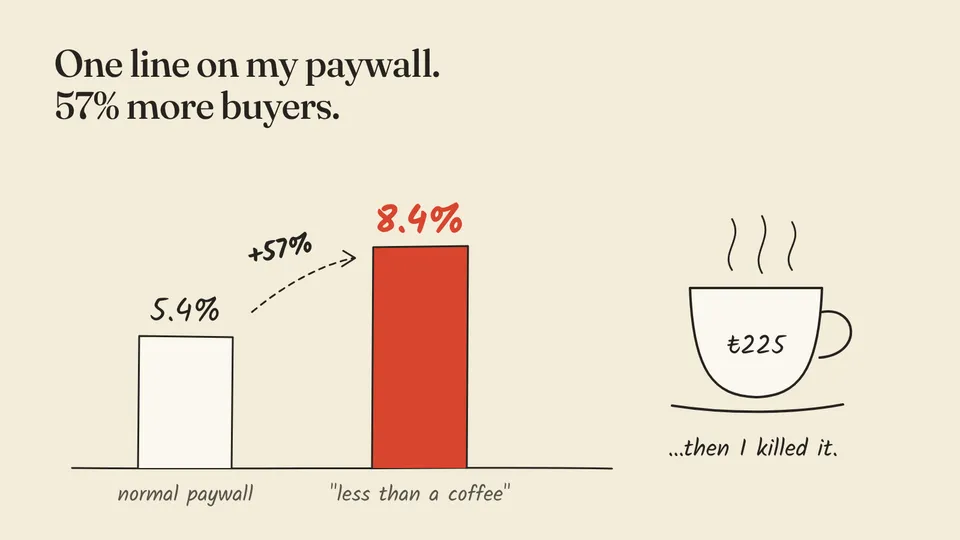
I ran a simple test on Ombra, my AI tattoo cover-up app. Half of Turkish users saw my normal paywall. The other half saw the same price with one new line: it costs less than a coffee.
10 days. 926 users.
- Normal paywall: 5.4% paid.
- Coffee paywall: 8.4% paid.
That’s 57% more paying users from one sentence. I shipped it to everyone the next day.
Three weeks later, I removed it.
Why one sentence works
There’s a name for it. When you frame a price as a tiny everyday cost, people compare it to small things they already buy, not to other subscriptions (Gourville, 1998). A weekly plan next to a coffee feels like nothing.
Why I killed a winning paywall
When I broke the funnel down step by step, the story changed.
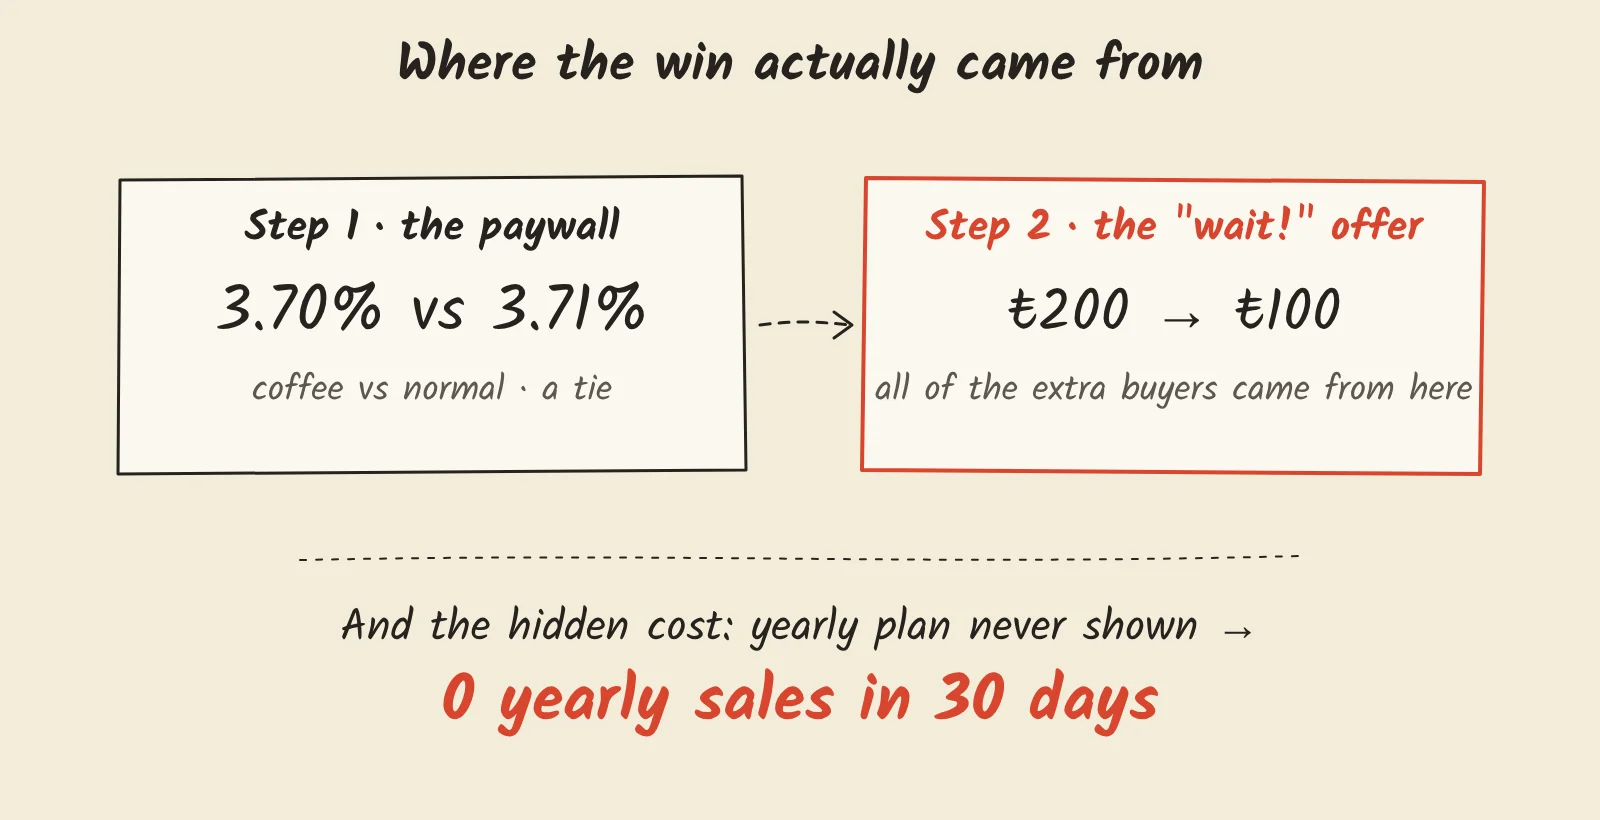
The coffee screen itself converted exactly like the old one: 3.70% vs 3.71%. The whole win came from the next screen, the discount offer people see when they close the paywall.
My best guess: once people had seen ₺200 next to a coffee, the ₺100 offer looked like a steal. That’s classic anchoring. The first number you see pulls every judgment after it (Tversky & Kahneman, 1974).
And the coffee screen had a hidden cost. It only sold the weekly plan. In 30 days, about 96% of my traffic never saw a yearly option. Yearly sales: zero.
That matters more than it sounds. Weekly plans convert better, but a year later only 5.5% of weekly subscribers are still paying, against 19.9% of yearly ones (Adapty, 2026). Zero yearly sales isn’t a detail. It’s a leak.
So I rebuilt the paywall: a before/after cover-up image, yearly and weekly side by side, yearly preselected.
Three things I’d check on your paywall
- Find the step that actually moved. A test that says “B won” tells you nothing about why. Your winning screen might not be the winner.
- Look for the plan nobody sees. One-plan paywalls quietly kill yearly revenue.
- Don’t change price mid-test. I doubled my Turkish weekly price (₺100 to ₺200) in the middle of this one. It muddied the data. And decide your sample size before you start, so you don’t stop the moment it looks good (Evan Miller).
The small print, because you’d ask: 39 of 462 vs 25 of 464 buyers, p = 0.067. A strong signal, not lab-grade proof.
Frequently asked questions
Was the result statistically significant?
Not quite. 39 of 462 vs 25 of 464 gives p = 0.067, just above the usual 0.05 line. It was a strong, consistent signal, not lab-grade proof, and I rolled it out knowing that.
What did the coffee line actually say?
It compared the weekly price to a coffee in Turkey, where the test ran (Turkish App Store prices only). The anchor price on screen was ₺225 against a ₺200 weekly plan.
What replaced the coffee paywall?
One paywall: a before/after cover-up image at the top, four feature lines, yearly and weekly plans side by side with yearly preselected, and one button. The real yearly price is always visible.
Sources
- Gourville (1998), Pennies-a-Day: The Effect of Temporal Reframing on Transaction Evaluation, Journal of Consumer Research 24(4)
- Tversky & Kahneman (1974), Judgment under Uncertainty: Heuristics and Biases, Science
- Adapty, Weekly vs. monthly vs. annual: which plan type should you offer? (2026)
- Evan Miller, How Not To Run an A/B Test